- View sweeps by clicking on an Analysis
Graph data point - Impose single and averaged sweeps
- Quarantine bad sweeps in reanalysis
- PopSpike Area, Amplitude & Latency
- Three types of Slope measurement
- Analyze all EPSPs in a sweep
- Special analyses of trains Rs measurement from unfiltered trace
- Convert WinLTP data files to ABF files
- Reanalysis of ABF, IBW and WCP files
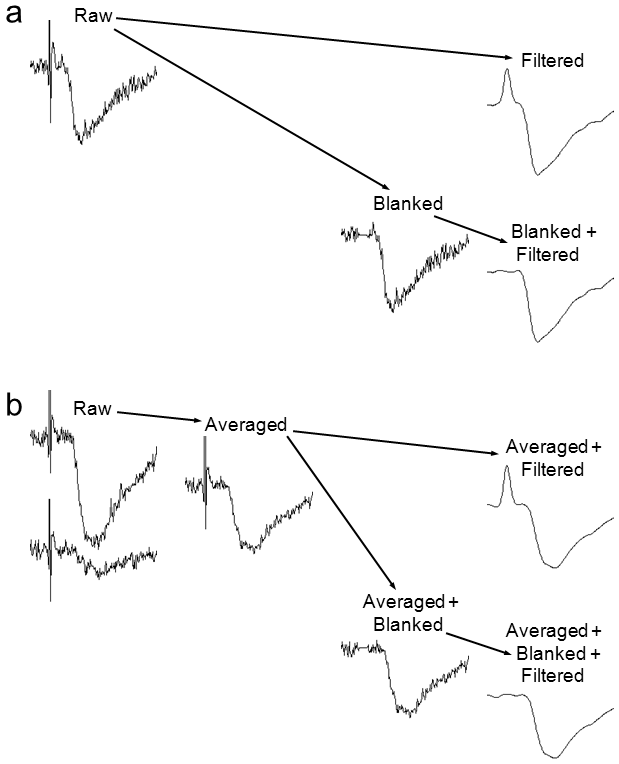
| Sweeps can be Signal Averaged, Stimulus Artifact Blanked, or Digitally Filtered Online |
In addition to capturing and analyzing raw sweeps, the WinLTP can also do on- and off-line signal averaging of these sweeps, blank out the stimulus artifacts if required, and low-pass filter the sweeps. Signal averaging occurs first, then stimulus artifact blanking, and finally low pass filtering.
Single
raw sweeps can either be (i) low-pass filtered, (ii) stimulus
artifact blanked, or (iii) stimulus artifact blanked and then
filtered (top part of the figure below), but not first filtered and
then stimulus artifact blanked.
The insets show a patch-clamp recording of an EPSC from one
raw sweep (left trace) showing substantial noise and a large
stimulus artifact at the left of the trace, the sweep that has been
digitally filtered to reduce the noise (note the large filtered
artifact, right top trace), the sweep with the stimulus artifact
removed (middle trace), and the stimulus artifact blanked sweep that
has then been filtered (right bottom trace).
For more information see Section 4.5 in the on-line WinLTP Manual.
 |
All these traces can be shown on the screen and saved to a data file. Calculations of slopes and peaks are made on the latest processed sweep. For example, if signal averaging, stimulus artifact blanking and digital filtering are being used, then the averaged, blanked and filtered sweep is the one that will be analyzed.